Engineering · Our Own Platform
OT network monitoring that listens — and detects anomalies.
Out of its engineering practice, Aganum has developed its own platform for OT network monitoring with anomaly detection. It works purely passively: it inventories the communicating devices, maps the network topology along the Purdue Model, understands the industrial protocols — and reports anomalies in plain language, with a report at the push of a button. Fully on-premise, without cloud.
01 The starting point
Built from field experience, not on a drawing board.
The same fundamental problem shows up in project after project: before measures or architecture can even be discussed, the foundation is missing — a complete, dependable picture of what actually exists in the OT network and what communicates with what. Classic IT tools do not fit here, because they can cause damage in a production plant. So Aganum built its own tool that closes exactly this gap.
The problem
Active scans are off-limits in OT — any intervention in the network can disturb a controller or trigger a plant standstill. At the same time, every sound security decision needs a complete asset inventory and an honest picture of the communication relationships. Many companies face exactly this contradiction: they are expected to create visibility, but must not touch the plant to do it.
The idea
A platform that does nothing but listen. It analyzes what the network reveals anyway — traffic and log messages — and builds a complete situation picture from it: devices, communication relationships, vulnerabilities, anomalies. It sends nothing into the OT network itself and is technically incapable of disturbing production.
02 Core characteristics
Six characteristics that make the difference.
Purely passive
The platform only listens and never sends packets into the OT network. It is technically incapable of disturbing, blocking or triggering production — the most important principle in any plant.
On-premise
No cloud backend, no phone-home. All data stays at the plant. Internet is optional, only to update vulnerability and threat lists — and even that can be done offline.
Anomaly detection
Baseline, rules and process analytics check every event: what is normal, what is prohibited, what falls outside the pattern? Anything unusual is reported — put into context rather than dumped as a flood of raw data.
Report at the push of a button
The presentable situation picture as a PDF: management summary, incidents, critical alerts, MITRE overview and zone status — instead of days of manual work in Excel.
OT-native
Understands the industrial language of the machines (Modbus, S7, EtherNet/IP, DNP3 …), detects process anomalies and assigns every device to the Purdue Model — not just the IT traffic around it.
Complements the SIEM
Not a competitor to existing security systems, but their OT supplier: the platform forwards its findings to the central SIEM via Syslog, CEF, LEEF or webhook.
03 How it works
From raw data stream to an assessable incident.
Every single observation passes through the same chain. That is the core: step by step, a raw event becomes an understandable incident in context — enriched with asset role, open vulnerabilities and threat context.
Capture
Different log formats are translated into one uniform event (normalization).
Evaluate
Baseline (what is normal?), rules (what is prohibited?) and process anomalies check every event.
Report
Anything unusual becomes an alert — with asset role, vulnerabilities, threat matches and priority.
Correlate
Related alerts are bundled into one incident and mapped to MITRE ATT&CK for ICS.
04 Inside the product
This is what it looks like in action.
Three excerpts from the interface — captured in a simulated plant environment in which the platform detects an ongoing attack.
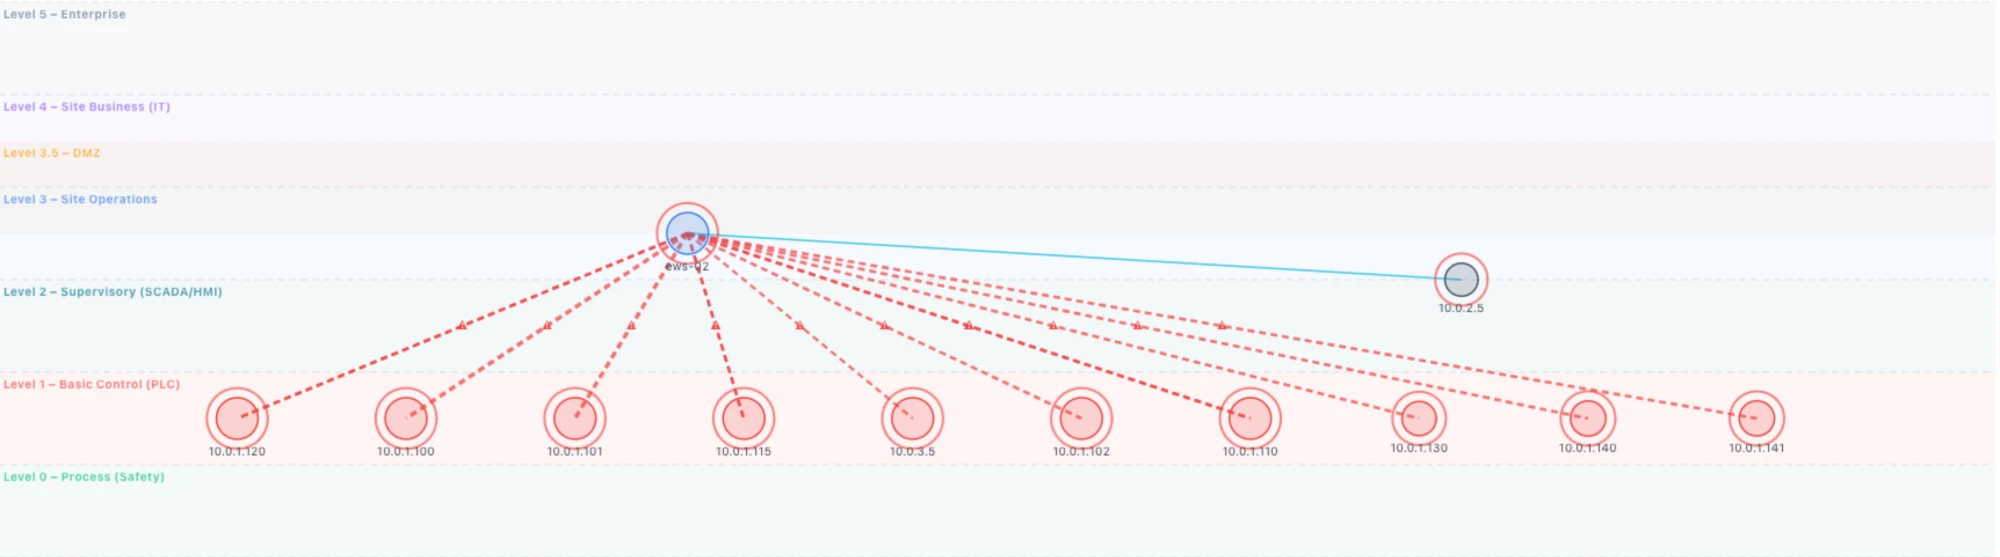
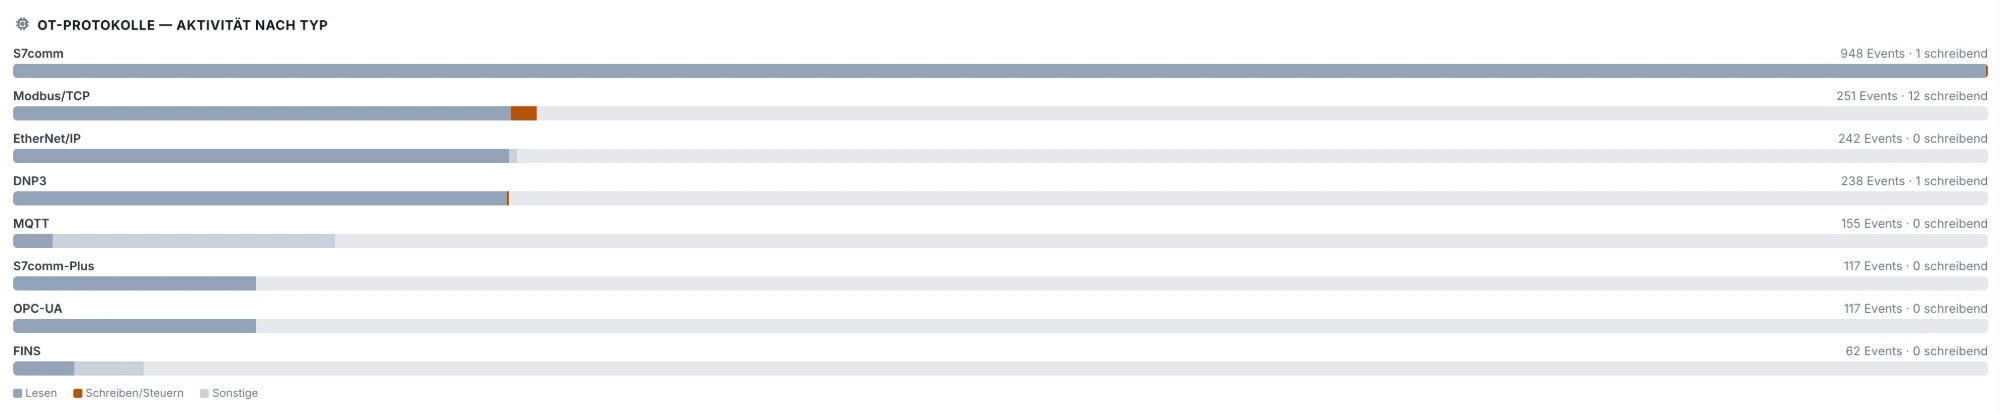
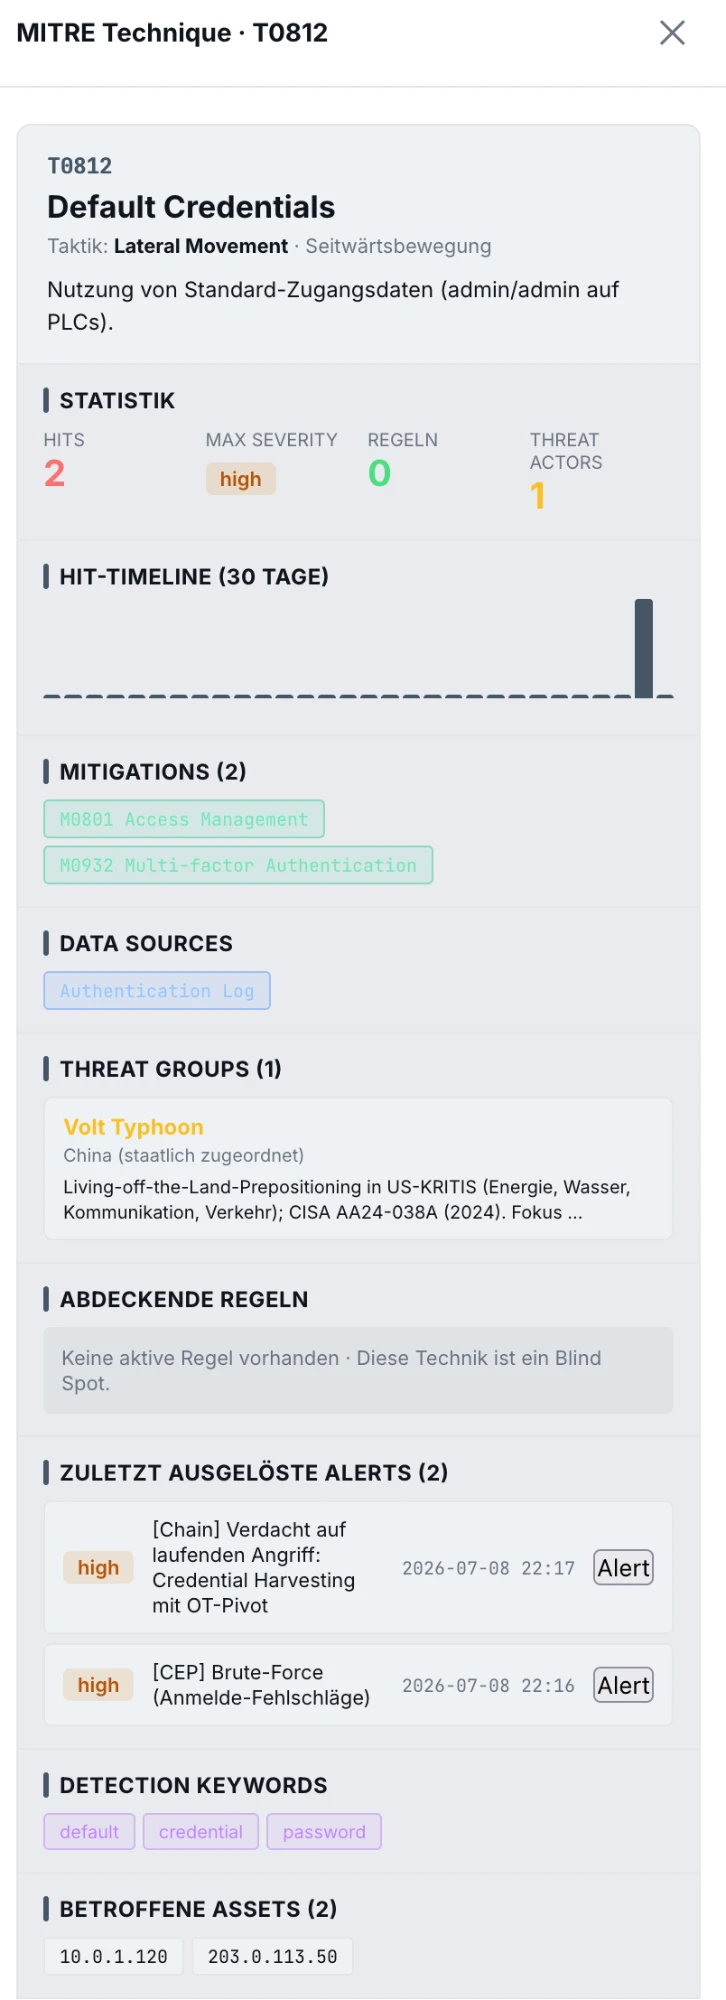
ALL SCREENSHOTS FROM A SIMULATION ENVIRONMENT — NO CUSTOMER DATA. PRODUCT UI SHOWN IN GERMAN.
05 Modules
Every view is its own tool.
The platform bundles several specialized modules — each one a distinct perspective on the same passively captured data.
01 Asset inventory
The automatic directory of all devices on the network. Devices are recognized and recorded from every event, maintainable with zone, criticality and owner.
02 Network topology
An interactive map: who talks to whom? Switchable to the Purdue Model view. Unwanted zone crossings are instantly highlighted in red.
03 OT protocols
The view of the industrial language of the machines. Recognizes protocols and function codes — say, a read versus a write command to a controller, or program transfers on the network.
04 Process anomalies
OT-specific irregularities right at the production process: a sudden standstill, slow drift, activity outside the shift or a reading outside the permitted range.
05 Vulnerabilities
Recognized products are matched against the official CVE database and the actively-exploited list (CISA KEV) — prioritized by actual exposure.
06 Report
The finished situation picture as a PDF at the push of a button — with management summary, incidents, MITRE overview and zone status.
06 The heart of it
FlowSR — where deterministic methods hit the wall.
Rules, signatures, baselines — deterministic methods are the foundation of all detection, and they are good. But in real plants they are not enough: the traffic is incomplete, the sensor coverage patchy, and the decisive question remains open — what actually is this device, and what is this connection doing?
So the platform gained an additional layer on top: FlowSR — Flow Signal Reconstruction. A machine-learning core that reconstructs network flows and derives device roles from incomplete traffic. Where the deterministic methods hit the wall, FlowSR fills the gaps.
Six model families, six answers from raw flows
Device role
PLC, HMI/SCADA, engineering workstation, historian, network device or IT server — recognized by its communication fingerprint.
Function, coarse
Does a connection read values — or does it write and control?
Function, fine
Write value, program transfer, control command or configuration.
Traffic shape
Cyclic control, bulk transfer, request/response or data stream — regardless of the port in use.
Temporal context
Resolves ambiguous flow patterns via periodicity, volume profile and off-hours behavior.
Machine vs. human
Is there an automated process behind a connection, or a person at a keyboard?
The extension · Deep Analysis
Connections become process understanding.
FlowSR works in two layers: the six model families read each flow on its own — what the device is, what the connection does. The Deep Analysis layer reads the temporal sequence and the structure of the whole network above them — and answers what no single flow can answer.
Sequence learning
the temporal order
Graph learning
the network structure
Fusion
both views combined
reads each flow on its own — role, function, shape, context, actor
Seven questions the Deep Analysis layer answers
Relationship purpose
Why does this connection exist in the process — control, monitoring, engineering, data storage?
Process phase
Which operating phase is the communication in — start-up, normal operation, intervention?
Asset role, coarse
The role assignment of the six families, confirmed from a second, independent view.
Asset role, fine
Finer-grained role profiles — which task a station takes on within the network.
Criticality
Which assets carry the process — a ranking derived from the communication structure.
Behavioral change
Has an asset changed its behavior compared with its own history?
Future relationships
Which communication relationships the plant will show next — the look ahead.
A connection becomes meaning. A bare connection becomes a verifiable interpretation: engineering workstation to PLC, program transfer, manual, outside the shift.
The principle: maximum from minimum. The leverage is greatest exactly where the least sensor coverage exists.
07 Deployment & role
Where the platform comes into play.
In projects
Aganum uses the platform in visibility projects wherever it is the fastest route to a first situation picture. The result feeds directly into the decision basis: asset inventory, communication matrix, vulnerability overview, report.
Alongside established platforms
Our own platform does not replace a vendor-neutral recommendation: where Claroty, Nozomi, Dragos or another solution fits the plant better, that solution is recommended and deployed. The tool choice follows the plant — not our own product.
Access control
A platform inside a sensitive OT network must itself meet high demands: role-based login (RBAC), API tokens and a complete record of every single action — part of the design from the start.
Traceable
Every detection is explained and traceable back to the triggering event — no black box. That is exactly what makes the findings dependable.
Curious what this would look like in your plant?
Aganum is happy to show the platform in a live demonstration — and to discuss how passive OT network monitoring translates concretely to your environment.